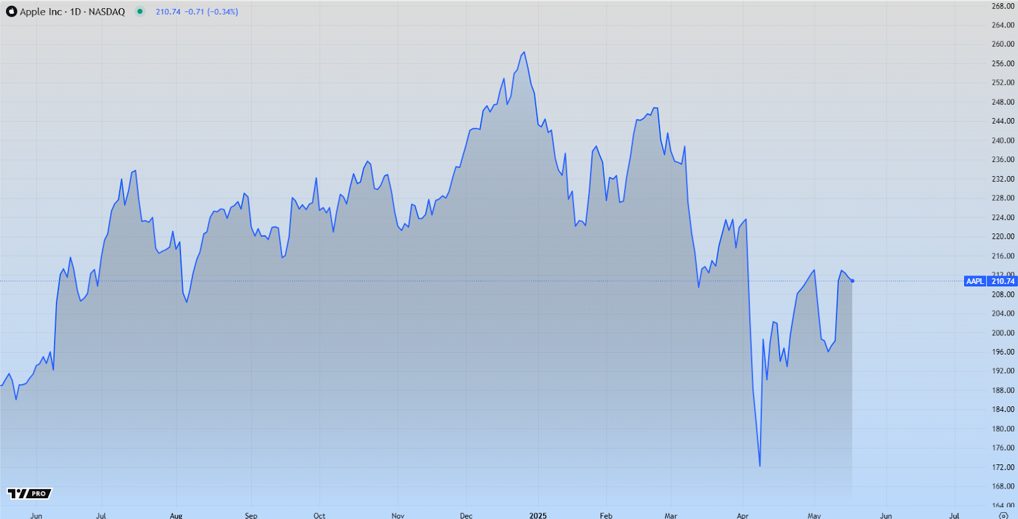
Cryptocurrency trading has gained a lot of popularity in recent years due to the massive profits that traders have been making. However, the cryptocurrency market is highly volatile, and prices can fluctuate drastically in a short amount of time, making it a risky market to trade in. To trade cryptocurrency safely, traders need to use indicators that can help them analyze the market trends and make informed trading decisions.
In this article, we will discuss the top 5 indicators that traders can use to trade cryptocurrency safely. Many smart traders are taking advice from Bitcoineer App which actually helps them to choose which is the best indicator for current market condition.
1. Moving Average
Moving Averages Moving Averages are one of the most popular indicators used in cryptocurrency trading. They help traders identify the direction of the trend and potential entry and exit points. Moving Averages are calculated by taking the average price of an asset over a specific period. The two most commonly used Moving Averages are the Simple Moving Average (SMA) and the Exponential Moving Average (EMA).
SMA takes the average price of an asset over a set number of periods and is a great indicator for identifying long-term trends. On the other hand, EMA gives more weight to recent price action, making it more responsive to changes in the market. Traders can use Moving Averages to identify the direction of the trend and to determine when to enter or exit a trade.

2. Relative Strength Indicator
Relative Strength Index (RSI) The Relative Strength Index is a momentum oscillator that measures the strength of an asset’s price action. It oscillates between 0 and 100 and is used to identify potential overbought or oversold conditions in the market. When the RSI is above 70, it indicates that the asset is overbought, and a price correction is likely to occur. Conversely, when the RSI is below 30, it indicates that the asset is oversold, and a price reversal is likely to occur. Traders can use the RSI to identify potential entry and exit points and to confirm the direction of the trend.
3. Bollinger Bands
Bollinger Bands Bollinger Bands are a technical analysis tool that helps traders measure volatility in the market. They consist of three lines – the upper band, the lower band, and the middle band. The middle band is typically a Moving Average, while the upper and lower bands are set a certain number of standard deviations away from the middle band.
Bollinger Bands help traders identify potential entry and exit points by showing when the market is overbought or oversold. When the price of an asset reaches the upper band, it indicates that the asset is overbought and a price correction is likely to occur. Conversely, when the price of an asset reaches the lower band, it indicates that the asset is oversold, and a price reversal is likely to occur.
4. MACD
MACD The Moving Average Convergence Divergence (MACD) is a trend-following momentum indicator that helps traders identify potential trend reversals. It consists of two Moving Averages – the MACD line and the Signal line. When the MACD line crosses above the Signal line, it indicates a bullish trend, and traders may consider buying. Conversely, when the MACD line crosses below the Signal line, it indicates a bearish trend, and traders may consider selling.
5. Fibonacci Retracement
Fibonacci Retracement Fibonacci Retracement is a technical analysis tool that helps traders identify potential support and resistance levels in the market. It is based on the Fibonacci sequence, which is a series of numbers where each number is the sum of the two preceding numbers. The most commonly used Fibonacci retracement levels are 38.2%, 50%, and 61.8%.
Traders can use Fibonacci Retracement to identify potential entry and exit points by looking for price action at these levels. When the price of an asset reaches a Fibonacci retracement level, it can act as a support or resistance level, and traders can use this information to make trading decisions.
In summary, the cryptocurrency market is highly volatile, and trading cryptocurrency safely requires a good understanding of market trends and indicators. The indicators discussed above are some of the most popular and effective indicators used by traders to analyze the cryptocurrency market and make informed trading decisions.
However, it’s important to note that no indicator is foolproof, and traders should always use a combination of indicators to confirm market trends and make trading decisions. Additionally, traders should always exercise caution and use risk management strategies to minimize potential losses.
In conclusion, by using these top 5 indicators, traders can increase their chances of trading cryptocurrency safely and profitably. These indicators can help traders identify potential entry and exit points, confirm the direction of the trend, and manage risk effectively. As the cryptocurrency market continues to grow, traders who use these indicators to analyze market trends and make informed trading decisions will have a significant advantage over those who do not.


